Today, I got the opportunity to start testing the new GapDebug from Genuitec. I've just dabbled with it a bit; so, I'm just going to post some initial info about my first impressions. As I use it more, I'll do another post if warranted.
First, I'll cover installation and setup. If you don't care out this, just skip to "GapDebug In Action" below.
Installation
Once accepted to the beta program, I had to download the installer. I'm not a big fan of "installers", but I trust Genuitec more than Google. I really like the GapDebug icon in the installer. The installer is your typical affair.
Once the installer is complete, the app shows a window informing you that GapDebug runs in the menu bar.


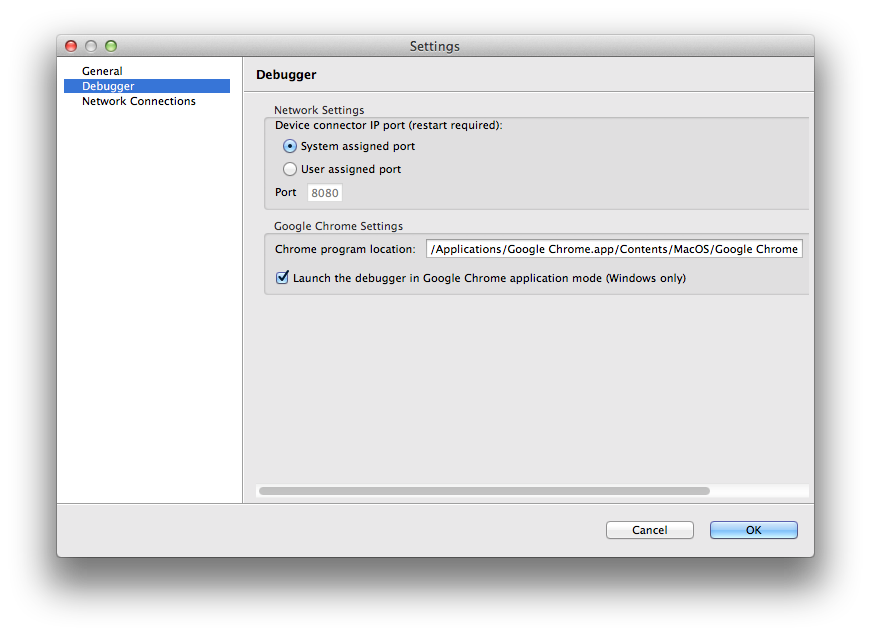
From the menu bar, I opened settings first. The default is to run the debugger in Chrome browser on port 8080. I tried changing this to launch the Google Chrome Canary browser instead. Unfortunately, this did nothing. The app would not launch Canary at all. It'd be great if this was fixed. I prefer using Canary over Chrome. I also changed the port as I use 8080 for my local API server for Kids In Touch.
Now, all is done and you can start debugging.
GapDebug In Action
GapDebug opens a tab in the Chrome browser. It detects any iOS or Android devices that are "debug-enabled" and connected via USB. I'm not sure what "debug-enabled" means. As I had already configured Mobile Safari to allow "Web Inspector", I was able to see an instance of Safari in the debugger.
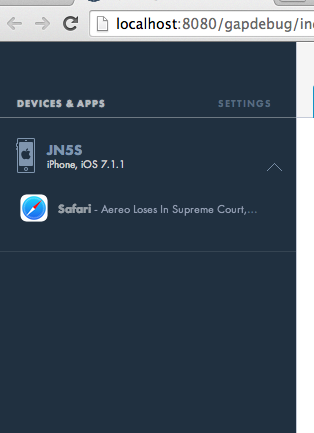
Unfortunately, I was not able to see the Cordova app that I had opened. The setup docs indicated the apps must be signed with a developer certificate. Of course, Kids In Touch was because I have submitted it to Apple on several occasions. However, I dabbled around in Xcode to check the certificates. Guess what? My certificates needed to be refreshed. Once I did that, GapDebug showed Kids In Touch available for inspection.
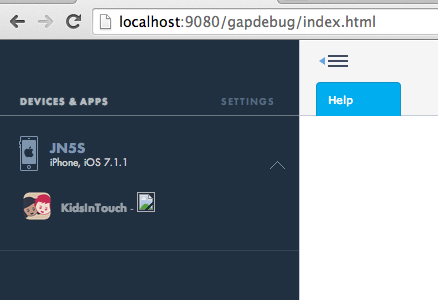
Initially, I must admit I was a bit underwhelmed with what I saw here. This is really nothing more than the existing Safari Webkit Inspector (iOS) or Chrome Dev Tools (Android). The GapDebug teaser video shows all the neat things you can do in it like live editing content and styles. You can do all of those things WITHOUT GapDebug. Bummer.
One Window To Rule Them All
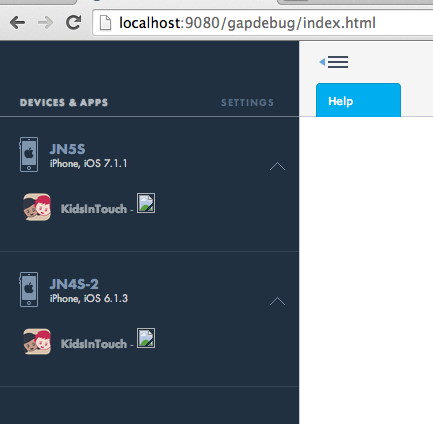
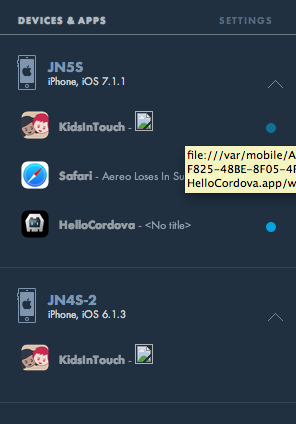
However, I started noticing some nice things after a bit. First, you can have more than one device connected and have access to both in the same window! Yes, Safari's Web Inspector can inspect more than one device, but it does it in one window per device. It's a pain juggling windows. GapDebug solves this by integrating an inspector in one view. Nice. Even better, it allows iOS & Android inspection in the same window. Very Nice.
Then, I realized I can have more than one app on the same device in the inspector at the same time. Sweet!
Does Windows & Keeps Them Open!
One thing I absolutely hate about the Safari Webkit Inspector is it's inability to stay open!!! If you background the currently inspected app, poof - bye bye inspector window. Then you have to open it up again. Over and over and over. What's worse is that any logging events that occur on app resume are USUALLY lost as you can't resume the app and get the inspector open before those events occur. SOMETIMES, Safari manages to display those logs. However, that is such a rare event that it makes you feel like you've won the lottery when it works.
GapDebug doesn't have this problem! Once you have the inspector open, it stays open. Like forever! It even stays open after the device screen locks. And, if the app is backgrounded and resumed, you get any logs for each event type. I've NEVER seen pause events in Safari Web Inspector. They show up just fine when using GapDebug.
This capability right here is the entire selling point of this free app. Now, if GapDebug could solve Ray Camden's "Somewhat Lame iOS Cordova Debugging Tip" problem, the world would be a better place. Being able to see app logs at launch would be amazing.
Better Local Storage Viewing
GapDebug somehow does a better job with seeing the Local Storage on iOS 6. Each time I try it, it's there. Almost 90% of the time in GapDebug.
Safari Webkit Inspector for iOS 6 only shows the Local Storage about 50% of the time. In fact, it seems to be getting worse and worse. In iOS 7, this problem doesn't exist.
Better Refresh with Ionic Framework Apps
In Safari Webkit Inspector, and therefore GapDebug, you can "refresh" the current view. In Safari, this always made my Ionic Framework apps go all janky and change the viewport size. Again, I'm not sure why, but I don't have this problem with GapDebug. I click the refresh icon and the view refreshes properly. This also solves the previously mentioned iOS 6 Local Storage issues. When using this in Safari, I had a choice : Messed up view + local storage info OR nice view with no local storage info. With GapDebug, I can have my local storage & proper view on refresh. Heaven!
Bigger Tabs Please
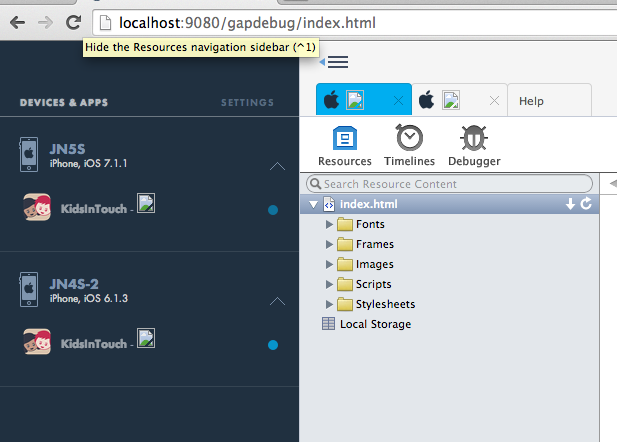
GapDebug has one "major" issue that I would like fixed. The inspector tabs aren't log enough to relate what they are. If you have 2 inspector tabs open for the same app on different devices, it's impossible to tell which tab is for which device.
Incremental Improvement
That's all I'm going to cover for now. Generally speaking, GapDebug doesn't get you any new inspecting abilities that you don't already have in Chrome or Safari. However, it wraps those abilities into a nicer package that works more consistently. For a beta level app, I'm pretty impressed. I had a few glitches here and there, but I think Genuitec will continue to make this better. I see this being my primary tool for debugging PhoneGap/Cordova apps.